[Listening to: ‘Desiree’ by the Left Banke; ‘Witness (1 Hope)’ by Roots Manuva; ‘You Can’t Sit Down (live)’ by Deerhoof; ‘Palatial Disappointment’ by Baths; ‘The Brokenhearted’ by Bruce Springsteen; ‘Who By Fire’ by the House of Love; ‘Forthright’ by Vic Chesnutt; ‘Ask’ by The Go-Betweens; ‘Red Light Green Light’ by The Fresh & Onlys; ‘Trampled Underfoot’ by Led Zeppelin]
Statistics justify and legitimise testing processes
In a recently-published piece titled ‘Psychology’s atomic bomb’, Denny Borsboom and Lisa D. Wijsen write:
The central role of educational testing practices in contemporary society can hardly be overstated. It is furthermore evident that psychometric models regulate, justify and legitimise the processes through which educational testing organises our lives. (2017, p. 440)
Take the Pearson Test of English (PTE) Academic. A decision made on the basis of a PTE score can have a major impact on a person’s life, such as in the recent high profile case of Dr Louise Kennedy reported on SBS News. Dr Kennedy apparently took the test as part of her efforts to meet the requirements of an Australian skilled migrant visa, expressed as points. Dr Kennedy had achieved 45 of the 60 points required to be eligible for the subclass 189 visa and aimed to demonstrate ‘Superior English’ to the Department of Immigration and Border Protection (DIBP) in order to get an additional 20 points.

DIBP offers several ways to ‘prove’ that you have superior English, described here:
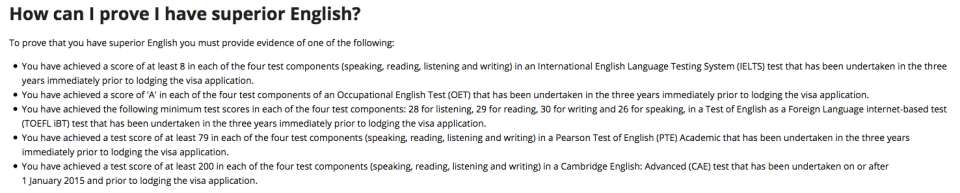
Dr Kennedy opted for the PTE but only scored 74. According to SBS, because she fell short, “she had to apply for the much more expensive spousal visa (which costs $7000), and requires upfront payment.”
This case sparked very lively – and remarkably similar – discussions in both the #AusELT and the LTEST-L groups. In both discussions, a couple of members suggested that Dr Kennedy should have prepared better for the test, that she take a different test and try again, and that the test was reliable and valid as evidenced by reports like this one full of impressive statistics like this:
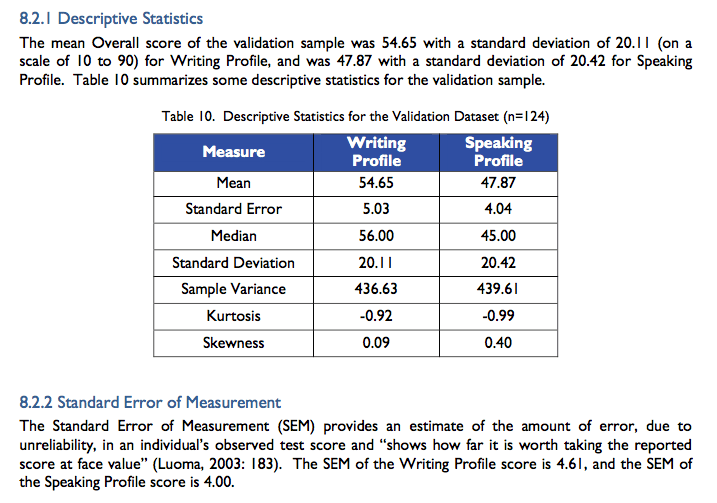
Pearson provide these statistics “for test users to make an informed interpretive judgment as to whether test scores would be valid for their purposes” and to support their claims that the PTE “adheres to sound theoretical principles and test development ethics,” which include “a rigorous procedure of qualitative review and psychometric analysis” (p. 47). As such, they are intended to (returning to the Borsboom and Wijsen quote) “justify and legitimise the processes through which [the PTE] organises our lives.”
And what’s wrong with that?
Statistics are a very effective way to justify and legitimise the use of psychometric test scores. When someone throws a 52-page report at you in response to questions about the validity of a test, at the very least, you’ll want a bit of time to digest it. However, they’re very daunting and many of us may lack the confidence in interpreting statistics to even try. After avoiding them for years, in the last 12 months I have made a concerted effort to understand statistics; I feel like I’m making progress but it’s slow going!
Fortunately, a 1996 article by Kuzon, Urbanchek and McCabe – titled ‘The Seven Deadly Sins of Statistical Analysis‘ – offers some support. The article was published in the Annals of Plastic Surgery, so there were references to ‘plastic surgical research’ and ‘plastic surgeons’ in the following opening lines, which are easily changed to relate to language testing:
[Language testing] has become increasingly sophisticated. The use of statistical analysis for the interpretation of [testing] data has grown from an occasionally to a commonly utilized tool. In general, however, [language test designers and users] lack a strong background in statistics. Errors in both the employment and the interpretation of statistical analysis are frequent in the [language testing literature].
To try to explain what these errors – or ‘sins’ – are, I’ll quote extensively from Kuzon et al. All italics are as the original. I’ll just cover Sins 1 and 2 in this post.
It’s important first to understand the four ‘levels of measurement’ underlying their analysis.
Measurement scales [such as the 90-point Pearson scale] can be nominal, ordinal, interval, or ratio. Nominal scales simply categorize data without assigning any hierarchical order. An example of nominal data would be compiling a list of [grammatical errors in students’ writing]. Although this nominal data allows one to distinguish between different [categories of error], in the absence of additional information it does not allow the [categories of error] to be ranked in order of gravity. Ordinal scales are used to rank data points hierarchically. A familiar ordinal scale is the ubiquitous ranking scale for [language proficiency]: poor, fair, good, excellent. The order of the various levels is well defined (excellent > good > fair > poor), but the interval between each level is not certain.
An interval scale has discrete, defined levels and, in addition, the interval between each of the levels on the scale is well defined (and usually equal). The number of [nouns used in a piece of writing] is an example of interval data. A given [piece of writing] cannot have 2.6 [nouns]. However, four [nouns] are twice as many as [two nouns], so the interval between levels of the scale is clearly defined. The level of variation being measured in usually scaled with equal units.
In a ratio scale, there is no restriction of a data point to a discrete level [such as 2 or 3 or 4]. Any value is permitted, including fractions. Ratio data meet all the qualifications of the previous levels of measurement [i.e., nominal, ordinal, interval], with the additional requirement that there must be a meaningful zero point representing complete lack of the characteristic. Scale values may be multiplied, added, and divided. Examples of ratio scales include temperature in degrees Kelvin, size in millimetres, molar concentrations, and weight in grams. (pp. 265-266)
Pause for a moment and reflect on the requirements of a ratio scale mentioned by Kuzon et al.: “a meaningful zero point representing complete lack of the characteristic” and also a unit of measurement. Does a ‘language proficiency’ scale meet these requirements? If so, what is the unit? Are we measuring, as Thorndike memorably put it, ‘ability-atoms’? Is there a ‘meaningful zero point’ when it comes to language proficiency? If not, are we forced to conclude that the values on the scale – the test scores – can’t be meaningfully multiplied, added and divided?
Pearson’s Global Scale of English – on which PTE scores are reported – starts at 10; it apparently has no zero point at all.
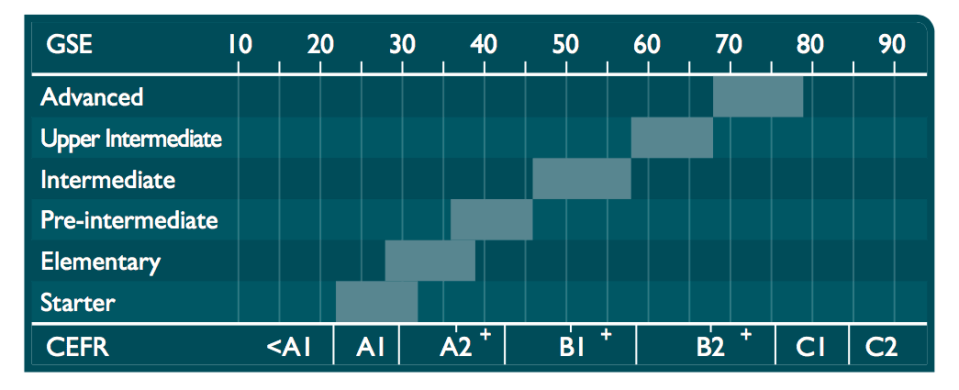
What type of scale is it then? It doesn’t seem to meet the requirements of a ratio scale. Does it meet the requirements of an interval scale? These are complex and controversial questions, as the title of the Kuzon et al. article implies.
Sin 1: Using parametric analysis for ordinal data
The basis of both Sin 1 and Sin 2 is disregarding the specific conditions about the parameters of the population being studied. Sin 1 is the use of a parametric statistical test for ordinal data analysis. (p. 265)
A ‘parameter’ is
a variable that expresses some property of the entire population … Population mean, variance, and standard deviation are the parameters most commonly used to describe a population [including in language testing]. Sample mean, standard deviation, and variance are the corresponding descriptive [parametric] statistics for a sample of data drawn from that population. However, parameters and statistics are calculated. That is, multiplication and division are used to compute the mean and variance. In order for these mathematical operations to be valid, the data must be expressed using an interval or a ratio scale.
Therein lies the sin: simply expressing ordinal data using integers [5, 9, 74, 79, etc.] does not justify the use of parametric statistics. Just as it is invalid to rank the results of a given [language test] as poor, fair, good, or excellent and state that the average result is “fair and a half,” it is invalid to rate those same outcomes as 1, 2, 3, or 4 and state the average result is 2.5. … To avoid committing Sin 1, for nominal or ordinal scaled data, use nonparametrical statistical analysis (see Sin 2). (p. 266)
Sin 2: Inappropriate use of parametric analysis
The most “common” statistical tests (Student’s t-test, analysis of variance, and least-squares regression analysis) are parametric tests. This means they use interval or ratio scaled data to calculate sample statistics with direct inference to population parameters. Before parametric statistical analysis is appropriate, certain sampling criteria must be met: (1) the study sample [i.e., the language test scores you are analysing] must be randomly drawn from a normally distributed population and (2) the sample size must be large enough to be “representative” of the study population. (p. 266)
If we randomly selected the scores of 100 PTE candidates, would they be normally distributed? We could assume that they were and proceed with our parametric analysis based on that assumption. But that assumption could be wrong, of course, and so, most likely, would the results of our statistical analysis.
I’m no expert but it seems to me that a number of the key statistical tests relied upon in the Pearson validity report I referred to above are parametric:
- Kurtosis
- Skewness
- Pearson product-moment correlation coefficient
- Pearson’s r correlation
Conclusion
It appears that Pearson have committed Sins 1 and 2: they’ve assumed that their scale is an interval scale and that their data is normally distributed. Thus, any conclusions drawn from the results of parametric statistical tests they’ve reported are highly likely to be wrong, denying them the justification and legitimisation they seek for their test.

I find statistics helpful when evaluating complex systems like testing.